
Using Quiver Quantitative’s Fear and Greed Index to Manage Leveraged ETF Volatility For More Successful Investment Outcomes
Using Quiver Quantitative’s Fear and Greed Index to Manage Leveraged ETF Volatility For More Successful Investment Outcomes
A Study by alphaAI
Richard Sun
May 22, 2024
Intro to Leveraged ETFs
Leveraged exchange-traded funds (ETFs) have long been in the portfolios of risk-tolerant investors seeking magnified gains. Leveraged ETFs typically use financial derivatives and debt to amplify the returns of an underlying index. While a traditional ETF seeks to track its underlying index on a 1:1 basis, a leveraged ETF may aim to track at a 2:1 or 3:1 ratio 1. This means that if the underlying index returns 1% over some period of time, the corresponding 3:1 leveraged ETF will return roughly 3% over the same period of time. Some variances will occur, and leveraged ETFs are also subject to volatility drag 2, but these are topics that will be covered in a separate study.
For the remainder of this study, the leveraged ETF we will specifically refer to is TQQQ. TQQQ is the ProShares UltraPro QQQ ETF and seeks daily investment results, before fees and expenses, that correspond to three times the daily performance of the Nasdaq-100 Index 3. TQQQ is one of the most popular leveraged ETFs on the market, with assets under management (AUM) in excess of $22 billion and an average one-month trading volume in excess of $60 million 4. Since the ETF’s inception in 2010, it has returned an average of 42.7% annually. In the last year alone, TQQQ returned 121.3%, compared with its underlying index, the Nasdaq-100, which returned 39.6% in the same time period (data as of 3/31/24) 5.

Source: Yahoo Finance
Volatility as a Measure of Risk
The primary challenge with TQQQ, and leveraged ETFs in general, is their extremely high volatility. This volatility, in turn, can lead to amplified losses. Since TQQQ aims to track the Nasdaq-100 at a 3:1 ratio, both gains and losses are magnified by roughly three times, with losses often being more pronounced due to volatility drag.
To quantify this problem, we will use volatility, a statistical measure of the dispersion of returns for a given security, fund, or investment strategy 6. Volatility is often measured as the annualized standard deviation of returns of the security in question, which is, in this case, TQQQ. You calculate volatility by finding the standard deviation of the returns and then adjusting it by the square root of the time horizon. For example, if you had the daily returns of an ETF in Excel, you would first calculate the standard deviation of those returns with the STDEV function. Next, you would multiply the result by sqrt(252) to get the ETF’s annualized volatility. We use 252 because there are 252 trading days in a year 7.
The Nasdaq-100 has an average annual volatility of roughly 28% (calculated based on daily returns since December 1998). In a normal distribution, 68% of the data falls within one standard deviation of the mean, and 95% of the data falls within two standard deviations of the mean. Although security returns are not necessarily normally distributed (a topic for a different study), this is the framework we will use to interpret volatility. So if you invested $1,000 in the Nasdaq-100, a volatility of 28% means that there is a 68% chance your portfolio value after one year will be within $720 and $1,280 and a 95% chance it will be within $440 and $1,560. The bottom line is that higher volatility is associated with a higher potential for gain but also a higher potential for loss. For reference, the S&P 500, the most widely used benchmark for the market, has an average annual volatility of roughly 17% (calculated based on daily returns since January 1990). Investors with a lower risk tolerance typically target portfolio volatility below 17%, while those with a higher risk tolerance typically seek volatility in excess of 17%. The best-performing investment strategies aim to deliver returns above the level of volatility taken on. One way of quantifying risk-adjusted return is through the Sharpe Ratio, which we will take a look at later on 8. Another metric we will discuss later is alpha, or an investment strategy’s ability to beat its benchmark 9.
The Problem with Leveraged ETFs
We have already established that the most significant problem with TQQQ is its high volatility. Since its inception, TQQQ has had an average annual volatility of roughly 61%. This means there is a 68% chance you could see returns between -61% and +61% in any given year. With higher volatility comes higher drawdowns, too. For example, in 2022, TQQQ lost nearly 80%. In an exceptionally bad year, TQQQ investors could stand to lose nearly 100% of their investment due to magnified losses combined with the daily rebalancing mechanics of leveraged ETFs and volatility drag.

Source: Yahoo Finance
This level of risk is simply not feasible for investors, nor is it recommended by alphaAI under any circumstance. So, the question remains: How can investors effectively take advantage of the magnified return characteristics of leveraged ETFs while controlling volatility and drawdowns? In the next section, we will introduce alphaAI’s approach to volatility management.
How alphaAI Approaches Volatility Management
At alphaAI, our automated investment strategies are based primarily on exposure management. Exposure is defined as the percentage of your portfolio you have invested at any given time. For example, an exposure of 50% would indicate that 50% of your portfolio is invested and 50% is held in cash. Exposure management is an extremely effective way to manage volatility since the less exposed an investor is, the lower that investor’s volatility will be. The idea behind exposure management is simple: We want more exposure when market conditions are favorable and less exposure when conditions are weak. However, the execution is the most difficult aspect.
We solved this problem by developing proprietary signals that we use to manage exposure. If you are unfamiliar with our AI system and the machine-learning (ML) techniques we used to build it, I recommend checking out our technology overview and our two-part series on ML for stock trading. At a high level, our AI system consists of multiple predictive models that are trained on multiple decades of data for over 10,000 global stocks. On average, each model is trained on more than 10 billion data points. Each model is trained to perform a unique predictive capability, and multiple models work together to make trading decisions 10. Our models work together to generate signals that quantify the level of risk in the market, and we use those signals to manage exposure in an automated and systematic way. Our system will be discussed in more depth in future studies.
As time passes, the market continues to generate data and correlations that have never been present before. This is why it’s impossible for a single signal to be effective 100% of the time. Thus, we recommend that our clients diversify their portfolios by running investment strategies based on multiple different signals. The probability of successful and consistent investment outcomes greatly increases when multiple signals are used together, as they cover each other’s weaknesses 11, 12. Our default strategy at the time of writing is based on the signals of over 100 different models, which greatly contributes to how we’ve produced market-beating results since our inception.
Thus, we continually develop and search for new signals to aid us. One signal that we’ve found particularly effective is Quiver Quantitative’s Fear and Greed Index.
Intro to Quiver Quantitative and the Fear and Greed Index
Quiver Quantitative is an alternative data provider catered to retail traders. Quiver aims to close the gap between institutional and retail traders by scraping alternative stock data from across the internet and aggregating it in a free, easy-to-use web dashboard 13. Access to more data enables retail traders to make more informed and, thus, better investment decisions. Some of Quiver’s most popular datasets cover trades made by members of Congress and company insiders.
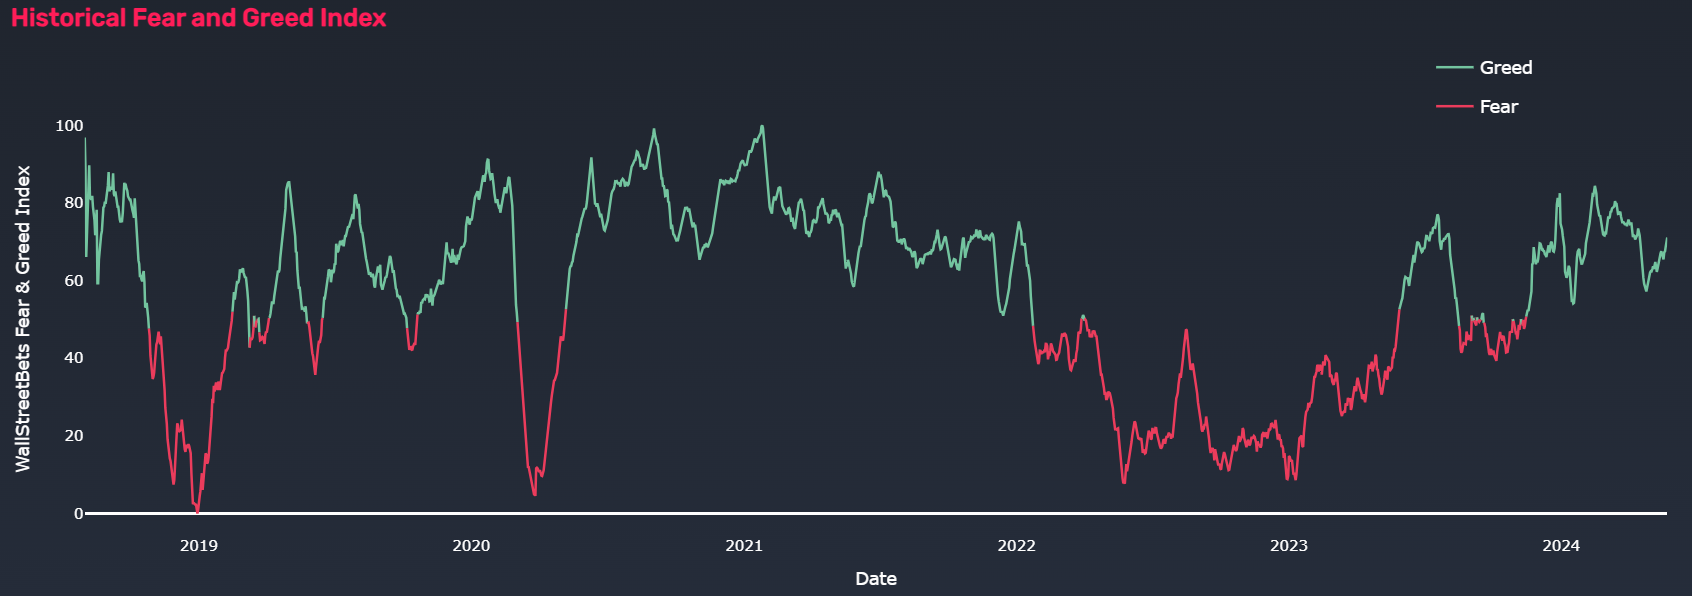
Quiver’s Fear and Greed Index (F&G) tracks the relative bullishness or bearishness of discussion on the WallStreetBets forum. WallStreetBets is one of the largest investment-related subreddits, where participants discuss stock and options trading. It became notable for playing a major role in the 2021 GameStop short squeeze that caused major losses to some institutional funds and short sellers 14. F&G is created by using natural language processing (NLP) to gauge the sentiment on the WallStreetBets forum. F&G is quantified as a number between 0 and 100, with 100 indicating the maximum level of bullishness, 0 indicating the maximum level of bearishness, and 50 being the midpoint. The data history begins in August 2018 and extends to the present. A new value is generated daily based on the previous day’s data, i.e., the data is one day lagged 15.

Source: Quiver Quantitative
Using Quiver Quantitative’s Fear and Greed Index to Manage Volatility
We hypothesize that using F&G to manage an investment strategy’s exposure level to TQQQ will yield a greater risk-adjusted return than a passive approach. Our analysis period will be from January 1, 2019, to April 29, 2024. We will compare the performance results of our risk-managed investment strategy using F&G (F&G Strategy) with a buy-and-hold approach of TQQQ (TQQQ Strategy) as well as a buy-and-hold approach of the S&P 500 (SPX Strategy).
Let’s first establish some baseline metrics. The TQQQ Strategy and the SPX Strategy yield the following results over the test time period:

As expected, the TQQQ Strategy yields a higher overall return than the SPX Strategy, but the volatility level of 66% corresponds to an unacceptable level of risk. Even more alarming is that the TQQQ Strategy experienced a 79% drawdown in 2022, rendering this strategy unfeasible for virtually all investors, regardless of their risk tolerance. For the level of risk taken, the TQQQ Strategy does not beat the SPX Strategy since the Sharpe Ratios for both strategies are the same (you can roughly think of the Sharpe Ratio as the return adjusted by the volatility).
Now, let’s describe the F&G Strategy. Our goal is to create a strategy that actively manages exposure to TQQQ in an automated and systematic way. We are targeting a portfolio volatility level of 30%, which roughly matches that of the Nasdaq-100 and is also the maximum level we are personally willing to accept as investors. To accomplish this, we propose a binary risk-on/risk-off approach that only trades TQQQ. When the value of F&G is 50 or greater (indicating relative bullishness), the strategy will be in its risk-on state, and exposure to TQQQ will be 70% of the portfolio’s value. When the value of F&G is below 50 (indicating relative bearishness), the strategy will be in its risk-off state, and exposure to TQQQ will be 20% of the portfolio’s value. The excess portfolio value will be held in cash and can be invested in a high-yielding money market or treasury fund to provide steady dividend income and further boost returns (this aspect will not be discussed in this paper).
When we run this strategy, we see a significant improvement in the investment outcome when compared to a passive approach:

Compared to the SPX Strategy, the F&G Strategy delivered greater overall returns and, more importantly, greater risk-adjusted returns, as illustrated by a Sharpe Ratio that is more than 60% better. Even more impressive is the F&G Strategy’s staggering 13.6% of alpha generated, indicating that the actions taken by our automated risk management system significantly contributed to our strategy’s outperformance over a buy-and-hold approach. Compared to the TQQQ Strategy, the volatility of the F&G Strategy was significantly lower and stayed below our target 30% range. More importantly, the drawdown in 2022 was reduced by more than half, from 79% to 34%, which is within our acceptable range. The bottom line is that using the F&G Index as a signal to manage risk resulted in a significantly better risk-adjusted return over a passive, buy-and-hold approach.
Below are some additional charts for your reference:

Source: alphaAI

Source: alphaAI
Conclusion
We conclude that using the F&G Index as a signal to manage risk resulted in a significantly better risk-adjusted return over a passive, buy-and-hold approach. Compared to the TQQQ Strategy, which was unfeasible due to its extremely high level of volatility and drawdowns, the F&G Strategy was viable and brought volatility and drawdowns into a controllable and expected range. Compared to the SPX Strategy, the F&G Strategy yielded significantly greater risk-adjusted returns and generated positive alpha.
It’s important to note that you, as an investor, will likely have a different level of risk tolerance. The parameters of the F&G Strategy, such as TQQQ exposure, can be adjusted so that volatility and drawdowns match your expectations, which is exactly what alphaAI helps you do in an automated way.
As previously discussed, as time passes, the market continues to generate data and correlations that have never been present before. This is why it’s impossible for a single signal to be effective 100% of the time. Thus, we recommend that our clients diversify their portfolios by running investment strategies based on multiple different signals. We recommend running a version of the F&G Strategy in addition to the other strategies offered by alphaAI. As of the time of writing, alphaAI’s default strategy is based on the signals of over 100 different models. Diversification of a portfolio’s strategies to multiple signals, including F&G, leads to improved investment outcomes over the long run.
If the types of investment systems described in this paper appeal to you, please consider checking out alphaAI and Quiver Quantitative. Don’t hesitate to reach out if you have any questions or feedback: support@alphaai.capital
References
- https://www.investopedia.com/terms/l/leveraged-etf.asp
- https://www.etf.com/sections/etf-basics/why-do-leveraged-etfs-decay
- https://www.proshares.com/our-etfs/leveraged-and-inverse/tqqq
- https://etfdb.com/etf/TQQQ/#etf-ticker-profile
- https://www.proshares.com/globalassets/proshares/fact-sheet/prosharesfactsheettqqq.pdf
- https://www.investopedia.com/terms/v/volatility.asp
- https://www.alphaai.capital/journal-entries/volatility-standard-deviation-why-should-you-care
- https://www.alphaai.capital/journal-entries/sharpe-ratio-risk-adjusted-returns-tell-a-different-story-than-absolute-returns
- https://www.alphaai.capital/journal-entries/alpha-the-holy-grail-of-investing
- https://www.alphaai.capital/journal-entries/our-technology
- https://www.neuravest.net/the-benefits-of-a-multi-strategy-investment-approach-2/
- https://www.investopedia.com/articles/trading/09/quant-strategies.asp
- https://www.quiverquant.com/aboutus/
- https://en.wikipedia.org/wiki/R/wallstreetbets
- https://www.quiverquant.com/fearandgreed/
Supercharge your trading strategy with alphaAI.
Discover the power of AI-driven trading algorithms and take your investments to the next level.

Explore Our Blog
Stay updated with our latest blog posts.
.jpg)
Popular “Buy and Hold Forever” Stock Lists: Historical Analysis and Lessons for Long-Term Investors


The Buy and Hold Investing Strategy: Core Principles and Modern Considerations for 2026
.jpg)
Are There Robo-Advisors That Include Crypto or Leveraged ETFs?